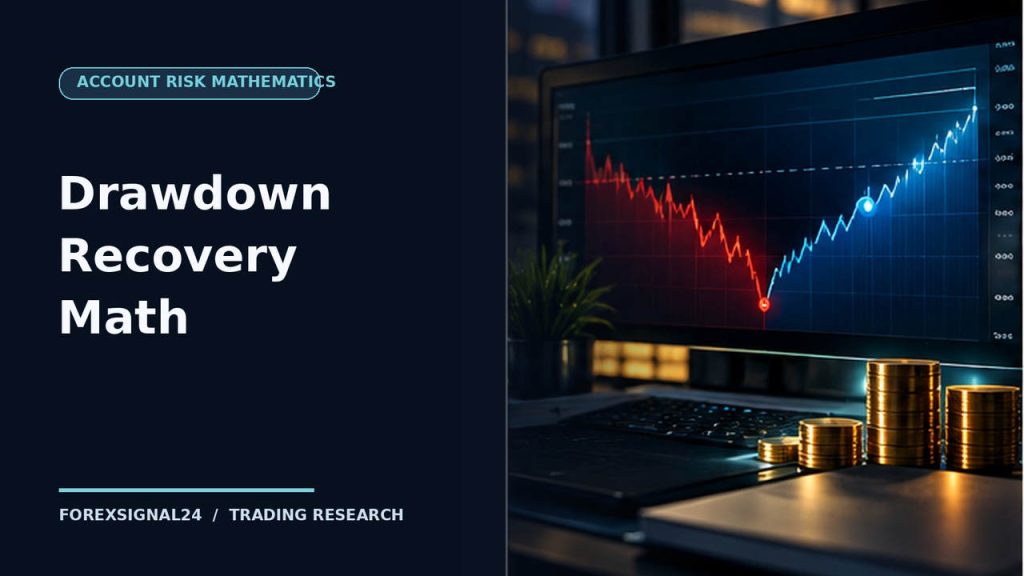
A 20% drawdown followed by a 20% gain does not restore the original account balance. The percentages use different starting amounts. Understanding that arithmetic helps traders evaluate position size and avoid the temptation to take increasingly large risks after losses.
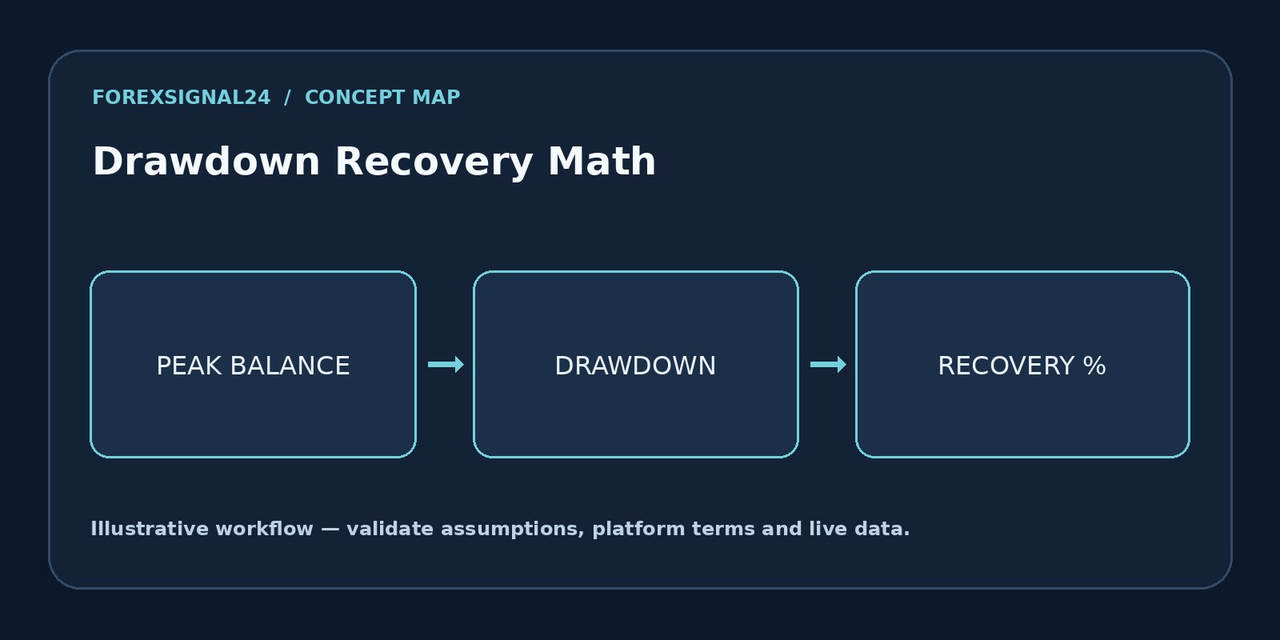
Drawdown is commonly measured from an equity or balance peak to a later trough. The exact method should be stated, especially when comparing a backtest, a live account or a performance statement.
The basic recovery formula
If an account loses a fraction d from a prior peak, the gain required on the reduced balance to return to that peak is d ÷ (1 − d). Multiply by 100 to express the percentage. This applies to percentage drawdowns smaller than 100% and assumes no deposits, withdrawals or other balance changes.
| Drawdown from peak | Gain needed from remaining amount |
|---|---|
| 5% | 5.26% |
| 10% | 11.11% |
| 20% | 25.00% |
| 30% | 42.86% |
| 50% | 100.00% |
For instance, a $10,000 account that loses 20% falls to $8,000. Returning to $10,000 requires $2,000, which is 25% of $8,000, not 20%.
Why ‘double the lot size’ is a dangerous shortcut
After a loss, the emotional impulse is often to aim for a faster recovery by increasing leverage. Yet a larger position amplifies both favorable and unfavorable price movement. A further loss from a reduced balance deepens the percentage recovery requirement even more.
Suppose the $8,000 balance in our example loses another 10%. It drops to $7,200. Restoring $10,000 would then require approximately 38.89% growth from $7,200. No change in market conditions guarantees that the next trade can deliver it.
A more robust approach is to define account-wide and per-trade limits before the losing streak starts. The Position Size Calculator can help apply a money-based risk limit to the current account size, not the old peak.
Balance drawdown versus equity drawdown
Balance-based statistics may exclude unrealized changes while positions remain open. Equity includes floating profit and loss, which can create a deeper temporary drawdown that disappears—or becomes realized—when trades are closed. If you compare systems, ask which definition was used, the observation interval and whether fees or deposits are included.
The position-sizing example in the stop-loss sizing guide illustrates why a risk budget belongs at trade entry, before emotion and market movement alter decisions.
Practical questions
Can a positive expectancy strategy experience a large drawdown?
Yes. Outcomes are uncertain and losses can cluster. Average expectancy does not specify the worst path of returns or the chance of encountering a long losing streak.
Is recovery math a trading strategy?
No. It quantifies the size of the recovery challenge. It does not predict future gains, determine a safe lot size or justify taking more risk.
Bottom line: protect the ability to continue making decisions. Preventing an extreme drawdown is generally more controllable than planning how to win it back.
Risk notice: Leveraged forex and CFD trading can cause substantial losses. The figures and examples are educational, not current quotes, investment advice or predictions. Verify instrument terms independently.