A long wick through yesterday’s high is easy to spot. Deciding whether it matters is harder. Sometimes price sweeps the level and snaps back. Other times the move keeps running, and what looked like a neat reversal setup becomes an expensive attempt to pick a top.
That distinction is the reason Smart Liquidity Hunter caught my attention. Rather than treating every pierced high or low as a signal, this free indicator for MetaTrader 4 and 5 checks a confirmed swing level against several price-action filters. It marks qualifying setups after the candle closes, leaving the trader to decide what to do with the information.
If you prefer to inspect the specifications before installing anything, the official Smart Liquidity Hunter guide covers the release, its inputs and the source files. This review focuses on how the indicator feels as a decision-support tool, where its filters add value and what can still go wrong.
What does Smart Liquidity Hunter actually look for?
Think of a confirmed swing high as a level that other chart users can also identify. Traders often discuss potential buy-side liquidity above such a high and sell-side liquidity below a swing low. Those are useful reference points, but they are not a window into the market’s actual resting orders. Smart Liquidity Hunter reads OHLC price data; it cannot see anyone’s stop-loss instructions.
A potential bearish sweep starts when a closed candle pushes above an eligible swing high, then finishes below it. A bullish sweep is the mirror image: price trades below a confirmed low and closes back above that level. A simple cross is not enough. The candle must also meet the configured penetration, wick and closing-position tests.
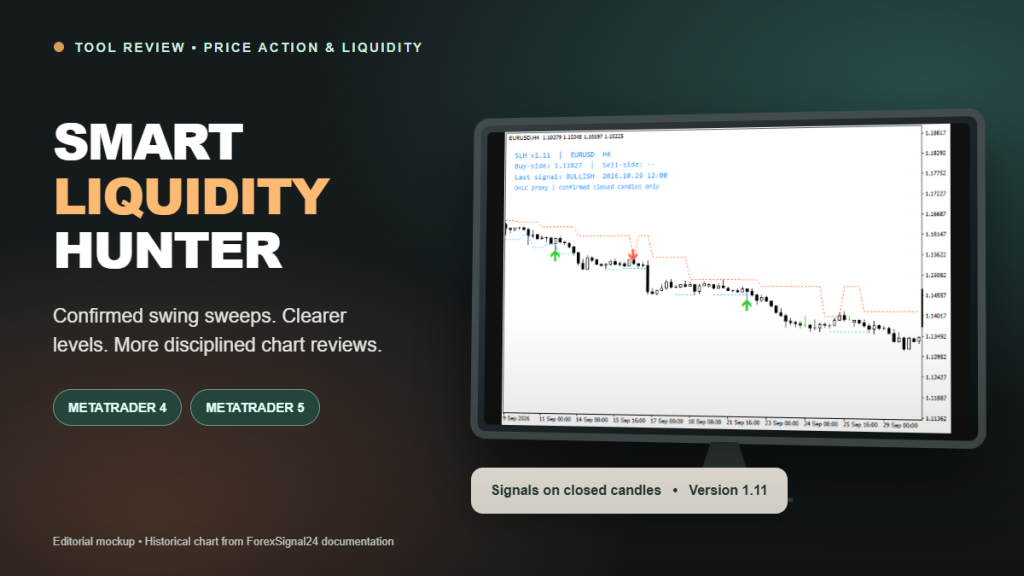
The end result is deliberately modest: green arrows below qualifying bullish candles, red arrows above qualifying bearish candles, dotted reference lines and a small dashboard. These are chart annotations, not automatic buy and sell orders.
Why waiting for a confirmed swing matters
Some indicators point to a high or low before that pivot has really formed. Smart Liquidity Hunter takes a more patient route. Its default SwingStrength of 3 requires three candles on each side of a candidate pivot. Only after the necessary newer bars have closed can that swing become an eligible reference.
There is a trade-off. You do not get the earliest possible line on the chart, but you are also less likely to build an interpretation around an unfinished pivot. For a sweep to qualify, the relevant swing has to have been confirmed before the signal candle began.
Another sensible default is RequireFreshLevel = true. If an intervening candle has already pierced the level, it is excluded from consideration. That helps prevent the same overworked swing from being presented as fresh liquidity again and again. It is still a price-based filter, not a claim that untouched orders must be waiting there.
The filters: a wick alone is not enough
The indicator sets a minimum distance beyond the swing using whichever is larger: a fixed point threshold or a volatility-adjusted threshold. At the documented defaults, the fixed component is 12 symbol points; the volatility component is 0.10 times the mean true range of the preceding 14 candles. That mean is a simple average of true ranges, not Wilder’s smoothed ATR.
Once that distance is cleared, the rejection candle still has work to do. The relevant upper or lower wick must account for at least 25% of the candle’s range, and the close must land in the stronger part of the range: the upper 40% for a bullish setup or the lower 40% for a bearish one. Requiring the candle to be green or red is optional and disabled by default.
These filters are not magic. Their appeal is that they make “that looks like a sweep” a repeatable, testable statement. You can compare two setups using the same criteria rather than adjusting your definition after seeing where price went.
Two examples: reading the chart without jumping to a trade
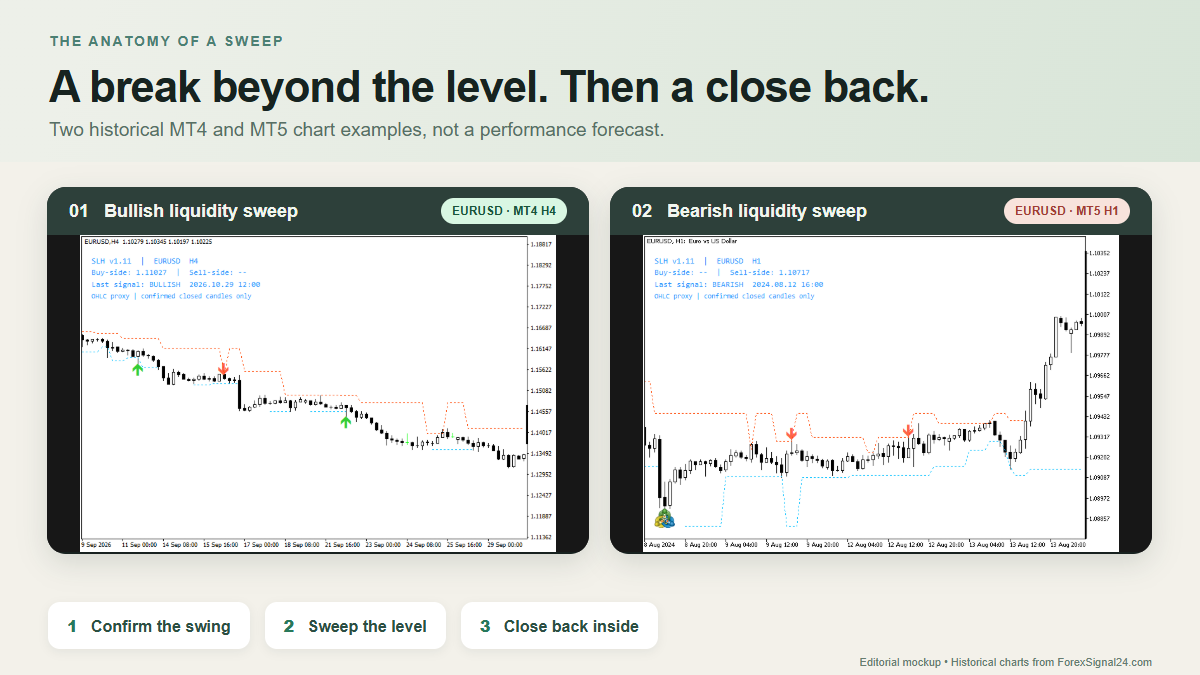
In the MT4 EURUSD H4 example, price moves below a previously confirmed swing low, then closes back above the reference. The plotted bullish marker tells you that the candle met the rules. It does not tell you whether the next session offered a suitable entry, a reasonable stop or enough reward to justify the risk.
In the MT5 EURUSD H1 example, price does the opposite: it reaches above a confirmed high, then closes back beneath it. That is useful context for someone watching a possible failed breakout. It is not proof that the trend has reversed.
My preference would be to read either marker alongside the higher-timeframe structure. Where is the next opposing level? Is the candle forming during an unusually volatile release? What would invalidate the trade idea? A chart can offer an attractive sweep and still leave those questions unanswered.
Features you will actually use
- MT4 and MT5 editions: separate free source files, with matching signal rules for both desktop platforms.
- Closed-candle signals: the unfinished candle does not receive an arrow, reducing the temptation to act on a still-changing pattern.
- Freshness and volatility filters: settings for prior level penetration, a fixed minimum sweep, a volatility ratio and candle rejection quality.
- Price reference lines: dotted eligible swing levels help explain why a marker appeared at that point.
- Compact dashboard: the chart symbol, timeframe, relevant levels and latest detected signal within the scanning window.
- Optional alerts: popup, sound and terminal-configured push notifications. All three start disabled, so you can turn on only what you need.
- Editable display: choose whether to show levels or the dashboard, adjust arrow spacing and give multiple instances unique dashboard IDs.
One detail worth knowing: alerts are intended for a normally updated chart when a new candle has just closed. Attaching the indicator to an old chart does not mean a burst of retrospective notifications will arrive for every historical arrow.
What I would test before making it part of a routine
First, keep the default settings and compare a handful of historical markers on your own broker’s data. Then change only one input at a time. A 12-point threshold does not mean the same thing on every instrument; EURUSD, XAUUSD and indices use different point sizes and behave very differently around major news.
Second, check what happens after the signal. Note both the clean reactions and the failures. If you only save screenshots of the attractive setups, almost any chart indicator will look more reliable than it is. A simple trading journal with the level, signal candle, market context and proposed invalidation point is more useful than a collection of arrows.
Finally, work out whether the setup is tradable after spread, commission and slippage. The marker does not calculate position size, recommend a stop-loss or manage the open position. If you need to translate a proposed trade into actual account exposure, the ForexSignal24 calculator hub is a useful place to continue.
The limitation that matters most
It is tempting to describe any closed-candle indicator as “non-repainting” and stop there. That would be too simplistic. Smart Liquidity Hunter does not place signals on the open candle, and it uses swings confirmed before each candidate signal. However, broker-history corrections, altered inputs and changes to the history window can still change what you see when reviewing old data. It also needs enough bars for swing confirmation, so there is an intentional delay.
There is also no verified win-rate claim in the official documentation. A sweep is a pattern, not an edge until it has been tested with a complete entry, exit and risk-management process. The tool is best treated as a structured observer of price behavior, not a substitute for judgment.
Where to download Smart Liquidity Hunter
The current documented version is 1.11. Both editions are published free in the MQL5 Code Base with source code. Use the version for your desktop MetaTrader terminal:
- MetaTrader 4: Smart Liquidity Hunter MT4 — official MQL5 download and source.
- MetaTrader 5: Smart Liquidity Hunter MT5 — official MQL5 download and source.
The files are .mq4 and .mq5 source files. Install the matching file in your terminal’s Indicators folder, compile it in MetaEditor and then attach it to a chart. The step-by-step installation and settings guide has the folder paths, default inputs and a full explanation of the calculation rules.
Bottom line: Smart Liquidity Hunter makes sense if you already trade with market structure and want a consistent way to flag possible failed breaks. The attractive part is not the arrow; it is the combination of confirmed levels, explicit rejection rules and a clear place to start your own review. Try it on a demo chart, be critical of the misses as well as the hits, and let your risk plan—not the indicator—decide whether a trade deserves to be taken.