A screenshot of three winning trades is not a backtest. A useful test starts with rules that another person could apply to the same chart and finishes with a record of costs, losses and uncomfortable market conditions.
Traders often ask whether a moving-average crossover, a London breakout or a support-and-resistance setup “works.” Without a written definition of entry, invalidation and exit, that question cannot be answered consistently. Different people will mark different trades after seeing how the chart turned out.
You do not need to write a trading robot to start testing. You do need a method that prevents the results from changing every time you look at them.
1. Define a setup before looking at the outcome
For illustration, suppose the candidate rule is: “On EUR/USD H1, consider a long only when the most recently closed candle is above the 50-period moving average and a subsequent pullback closes back above the previous candle’s high. Place the stop at a defined recent swing low; set a target of twice the entry-to-stop distance.”
This is an example of a testable specification, not a validated strategy. It is still incomplete until you define the exact swing calculation, market session, spread assumption and order execution convention. The point is to make ambiguous phrases measurable.
Before you review historical trades, fix your sample window and write down what constitutes a skipped signal. Do not quietly delete a trade just because it later loses.
2. Separate training data from unseen data
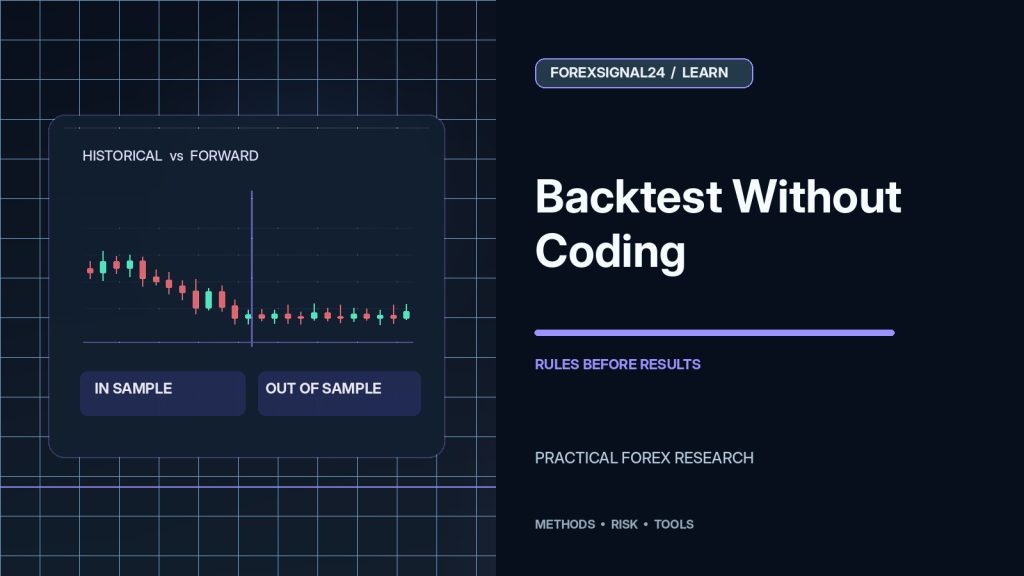
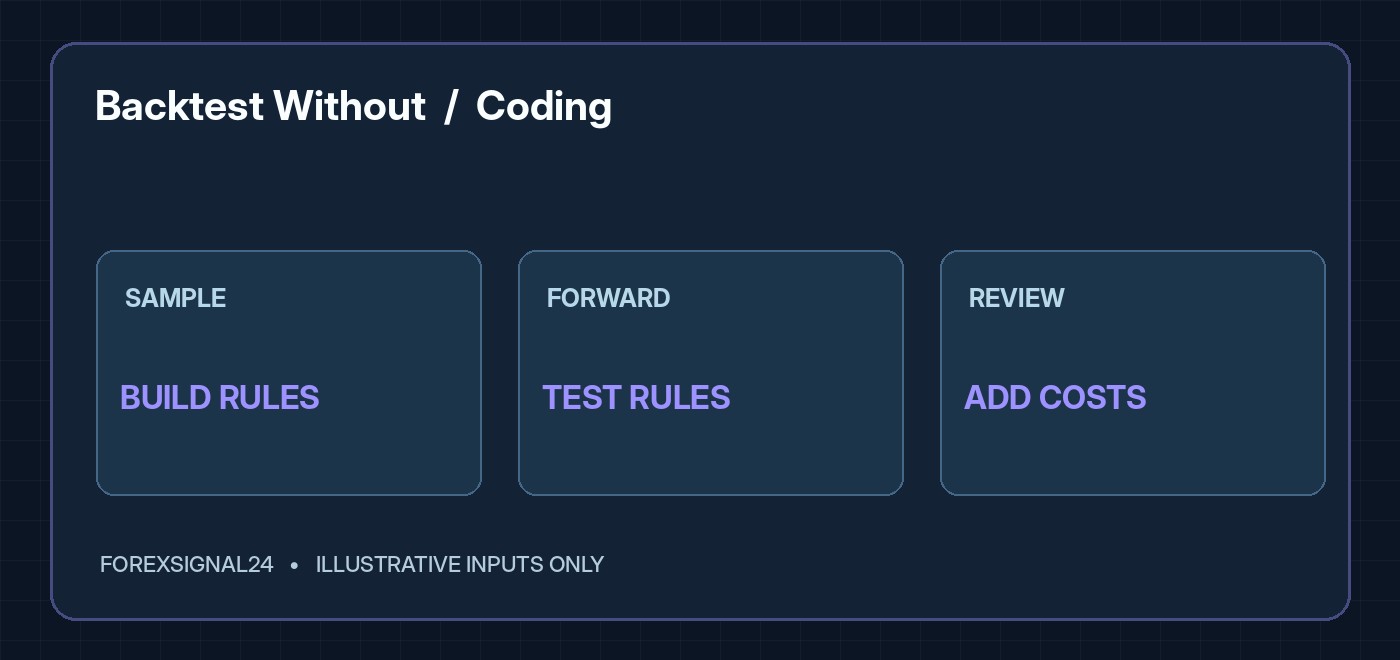
One practical approach is to use an older period to design a strategy and a later period that you will not consult until the rule is frozen. Choosing parameters on the entire history and then calling the result “out of sample” is a common form of hindsight bias.
For systematic strategies, MetaTrader 5’s official Strategy Testing documentation describes historical testing, optimisation and forward periods. A manual tester can adopt the same separation even without writing an Expert Advisor.
3. Record a complete trade, not just the final profit
At minimum, log date and time, instrument, entry, stop, target, session, reason for entry, planned monetary risk, actual outcome and execution costs. Add a screenshot taken at the decision point and another after exit. Use a consistent denomination such as R-multiples: an outcome of +2R means a gain equal to twice the initial planned risk; −1R means a loss of that initial risk amount before any costs omitted from the definition.
Check planned lot sizes with the Position Size Calculator and evaluate reward-to-risk assumptions through the Risk / Reward Calculator. If a backtest ignores spreads or commission, it may look substantially better than the approach would behave in a live account.
4. Measure expectancy and drawdown
A strategy with a 40% win rate and an average win of +2R versus an average loss of −1R has a simple illustrative expectancy of (0.40 × 2R) − (0.60 × 1R) = +0.20R before fees and slippage. That arithmetic is not evidence that this outcome will persist. Results depend on the distribution of trades, sample size, execution and changing market conditions.
Record the longest loss sequence and the largest peak-to-trough drawdown in the test. A positive average outcome is not automatically compatible with your risk tolerance or the margin constraints of your account.
5. Challenge the result
Repeat the test across different months, volatility conditions and session windows. Ask whether the result collapses when costs increase slightly, whether one extraordinary trade accounts for most of the profit, and whether changing a parameter by one notch changes everything. Fragile parameter choices deserve caution.
Keep a separate forward-demo log after completing the historical analysis. Forward observation tests whether you can follow the rules without the benefit of hindsight. It does not guarantee profitability, but it can expose practical errors the chart review missed.
Where AI fits
A chatbot can help transform a rough strategy description into an unambiguous checklist, design a journal template, or check whether your test log has missing fields. The AI forex assistant workflow shows how to keep those tasks separate from unsupported price predictions. It cannot establish that an untested strategy has an edge. If you request calculations from AI, recompute a sample independently.
FAQ: How many backtest trades are enough?
There is no universal number. More trades can improve visibility into variation, but data quality, changing regimes, dependence between trades and the complexity of the rules matter. A handful of favourable examples cannot establish reliability.
FAQ: Is demo forward testing the same as live execution?
No. Demo environments can differ from real-money liquidity, slippage, fills and psychology. Record those limitations instead of assuming the environments are interchangeable.
FAQ: Can I backtest without buying software?
You can begin by reviewing historical charts and recording rule-based trades in a spreadsheet. Platform features vary; check available built-in tools and their terms.
This is an educational testing framework, not a recommended trading strategy.