On this page
Price can move through a familiar high or low, then close back on the other side. Smart Liquidity Hunter helps you find those moments on a MetaTrader chart. It marks qualifying sweeps of confirmed swing levels and shows the price references behind them, so you can review the setup in context.
Download Smart Liquidity Hunter
Current documented version: 1.11. The indicator is available free in MQL5 Code Base, with separate source files for MetaTrader 4 and MetaTrader 5. Choose the version that matches your desktop terminal.
MetaTrader 4
Source file: Smart_Liquidity_Hunter_MT4.mq4
MetaTrader 5
Source file: Smart_Liquidity_Hunter_MT5.mq5
The downloads contain source code. Compile the correct file in MetaEditor before attaching it to a chart. Both editions use the same signal rules, and the source header declares the MIT License.
What the indicator shows
Smart Liquidity Hunter uses open, high, low and close prices to identify potential liquidity sweeps. A previous swing high represents a buy-side reference; a previous swing low represents a sell-side reference. These are price-based proxies. The indicator cannot see resting orders or the actual location of other traders’ stop losses.
- Green arrows: qualifying bullish sweeps, plotted below the closed candle.
- Red arrows: qualifying bearish sweeps, plotted above the closed candle.
- Dotted reference lines: eligible swing highs in orange-red and swing lows in blue.
- Dashboard: symbol, timeframe, reference levels and the most recent signal within the scanned history.
- Optional notifications: popup, sound and terminal-configured push alerts.
Use the markings to organize chart review. An arrow identifies a price pattern that passed the configured filters; it does not establish that a reversal will follow. The indicator does not place, modify or close trades.
How Smart Liquidity Hunter works
Start with a confirmed swing
The default swing strength is three candles on each side of a pivot. The indicator waits for the newer confirmation candles to close before that pivot becomes eligible. A potential signal is evaluated against a swing that was already confirmed before the signal candle began.
It selects the nearest eligible high and low within the maximum swing age. With the freshness filter enabled, a level is excluded if an intervening candle has already pierced it. A simple touch does not automatically make a level unusable.
Require a meaningful sweep
The required penetration is the larger of a fixed point distance and a volatility-based distance:
Required sweep = max(MinSweepPoints × symbol point, MinSweepVolRatio × preceding mean true range)
Price must move strictly beyond that distance. The volatility measure is the simple average of true ranges from the preceding 14 candles by default, excluding the signal candle. It is not Wilder’s smoothed ATR.
Bullish sweep: below a low, then back above it
A closed candle must trade below an eligible swing low by more than the required distance, then close above that level. Its lower wick must meet the minimum wick percentage, and its close must finish sufficiently high within its own range.
Bearish sweep: above a high, then back below it
A closed candle must trade above an eligible swing high by more than the required distance, then close below that level. Its upper wick and closing position must pass the equivalent rejection filters.
At the defaults, the relevant wick must occupy at least 25% of the candle range. A bullish candle must close in the upper 40% of its range; a bearish candle must close in the lower 40%. Candle color is optional: by default, a bullish marker does not require a green candle, nor a bearish marker a red candle.
A candle that qualifies in both directions is skipped. The unfinished candle never receives a signal arrow.
Examples on real MetaTrader charts
These historical screenshots come from the published indicator examples. They show how the markings appear on a chart, rather than a forecast or a performance result.
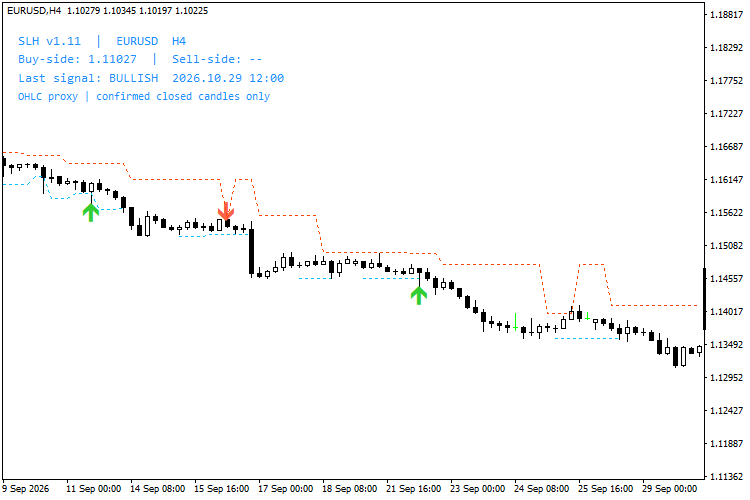
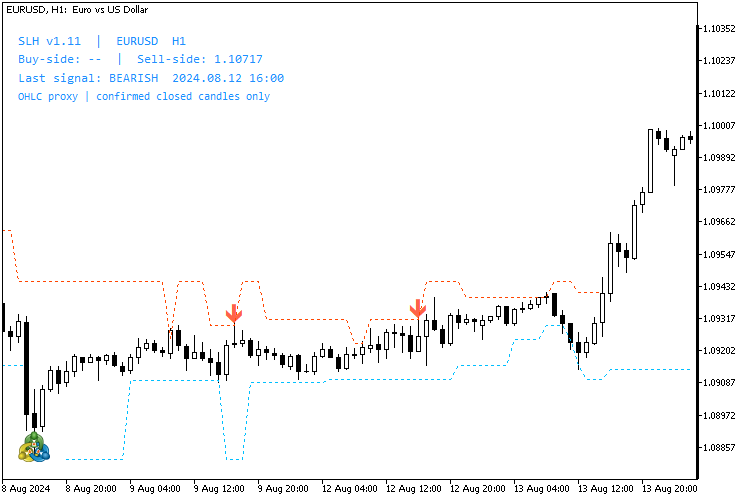
The dashboard reports the latest signal in the scanned history. Its timestamp may therefore refer to a different candle from the historical example visible on screen.
Settings and default values
Start with the defaults to understand the behavior. Change one input at a time and compare the result on the same symbol and timeframe.
| Input | Default | What it controls |
|---|---|---|
SwingStrength | 3 | Confirmation candles on each side of a swing. |
MaxSwingAge | 100 bars | Maximum distance between the candidate signal and its reference pivot. |
MaxBarsToScan | 1,000 bars | Maximum closed historical candles calculated and displayed. |
MinSweepPoints | 12 points | Fixed component of the sweep threshold. |
VolatilityPeriod | 14 bars | Preceding true ranges included in the simple average. |
MinSweepVolRatio | 0.10 | Mean true range multiplier for the volatility threshold. |
MinWickPercent | 25% | Minimum lower or upper rejection wick as a share of candle range. |
MinCloseLocationPct | 60% | Close position measured from the low for bullish signals, or high for bearish signals. |
RequireFreshLevel | true | Exclude levels pierced before the candidate signal. |
RequireCandleColor | false | When enabled, require close above open for bullish signals and below open for bearish signals. |
Points, pips and a worked threshold
On a five-decimal EURUSD quote, one symbol point is 0.00001. The default 12 points equals 0.00012, commonly 1.2 pips. If the preceding mean true range is 0.00100, its 0.10 multiplier gives 0.00010. The larger threshold is therefore 0.00012.
For an eligible swing low at 1.10000, the candle low must fall below 1.09988, then close above 1.10000 and pass the remaining filters. A low exactly at 1.09988 is insufficient. Gold and other instruments have different point specifications; do not reuse forex pip assumptions without checking the symbol.
Display controls
| Input | Default | Purpose |
|---|---|---|
ShowLiquidityLevels | true | Show the dotted swing reference lines. |
ShowDashboard | true | Show the information panel. |
ArrowPaddingPoints | 8 points | Minimum arrow spacing beyond the candle. |
ArrowOffsetVolRatio | 0.18 | Volatility-based spacing; the larger of the two offsets is used. |
DashboardInstanceId | A | Unique identifier of 1–40 characters for each copy on the same chart. |
DashboardTextColor | DodgerBlue | Panel text color. |
DashboardX / DashboardY | 15 / 30 pixels | Panel distance from the left and top edges. |
For two instances on one chart, use different IDs, such as A and B, and separate vertical positions. Arrow positions include visual padding; they are not entry or stop-loss prices.
How to install on MT4 or MT5
- Download the correct
.mq4or.mq5source file from the links above. - In your desktop terminal, select File → Open Data Folder.
- Place the MT4 file in
MQL4/Indicators, or the MT5 file inMQL5/Indicators. - Open that file in the matching terminal’s MetaEditor. Select Compile or press F7.
- Check that compilation finishes without errors. This creates the platform’s executable indicator file.
- Refresh the terminal’s Navigator, or restart the terminal if necessary. Attach Smart Liquidity Hunter from Indicators to your chart.
- Keep the default settings initially and allow enough price history to load.
The source is standalone and does not need external includes or DLL imports. Install it in the terminal you actually use; separate broker installations can have separate data folders.
Alerts and everyday use
AlertPopup, AlertSound and AlertPush all default to false. Enable the channels you need. Sound alerts use alert.wav; push alerts require the terminal’s notification settings to be configured.
Notifications are checked after a normal update with one newly closed candle. The indicator suppresses duplicate notices for that candle. Initial attachment, history resets and catch-up batches do not trigger historical alerts, even when arrows appear in the loaded history.
When reviewing a marker, check the surrounding trend, nearby price structure and current trading costs. Decide separately whether there is a usable trade plan. The indicator does not calculate a recommended position size, stop loss or profit target.
Closed-candle behavior and limitations
Signals use closed candles and swings confirmed before those candles. The open candle has no signal arrow. That design avoids provisional intrabar arrows, but it should not be described as an unconditional promise that historical output can never change.
Broker history corrections, different inputs and changes to the calculation window can alter historical output. Older signals also leave the displayed window as new candles arrive. Swing confirmation adds an intentional delay, and different broker feeds can produce different markings.
Version 1.11 makes dashboard object names stable across profile reloads to prevent duplicate labels. Its signal calculations are unchanged. Neither a screenshot nor a marked sweep establishes a win rate or future profitability.
Frequently asked questions
Why are there no arrows on my chart?
No qualifying setup may exist within the scanned history. Check that enough candles are loaded and that the indicator compiled successfully. A sweep must pass every enabled filter; crossing a swing level alone is insufficient.
Why does a level appear later than its swing candle?
The swing needs confirmation from subsequent closed candles. At the default strength, three candles on its newer side must be available before it can be used for a later signal.
Does a bullish arrow mean I should buy immediately?
It means the candle met the bullish sweep rules. Entry timing, invalidation, position size and whether to trade remain separate decisions. Price can continue against the apparent rejection.
Can I use it on another symbol or timeframe?
The calculations use the attached chart’s prices, timeframe and symbol point size. Review the behavior on that particular market before adjusting settings. The default thresholds are not evidence of an optimal configuration for every instrument.
Build the rest of your trade plan
After reviewing a setup, use the Position Size Calculator to estimate exposure, the Risk / Reward Calculator to compare a proposed entry, stop and target, and the Trading Cost Calculator to account for spread and commission assumptions.
Official sources: MT4 Code Base release and source; MT5 Code Base release and source; MetaEditor compilation guide; MQL4/MQL5 folder structure.